
MXGPU Tools: Setlist Engine
Sonora Festival, Apulia, 4 July 2026. Two days before that show we turned a design prototype for our setlist into a small web app. It now lives at setlist.mxgpu.net: one page on screen, one A4 sheet on paper, the same numbers for everyone on stage.

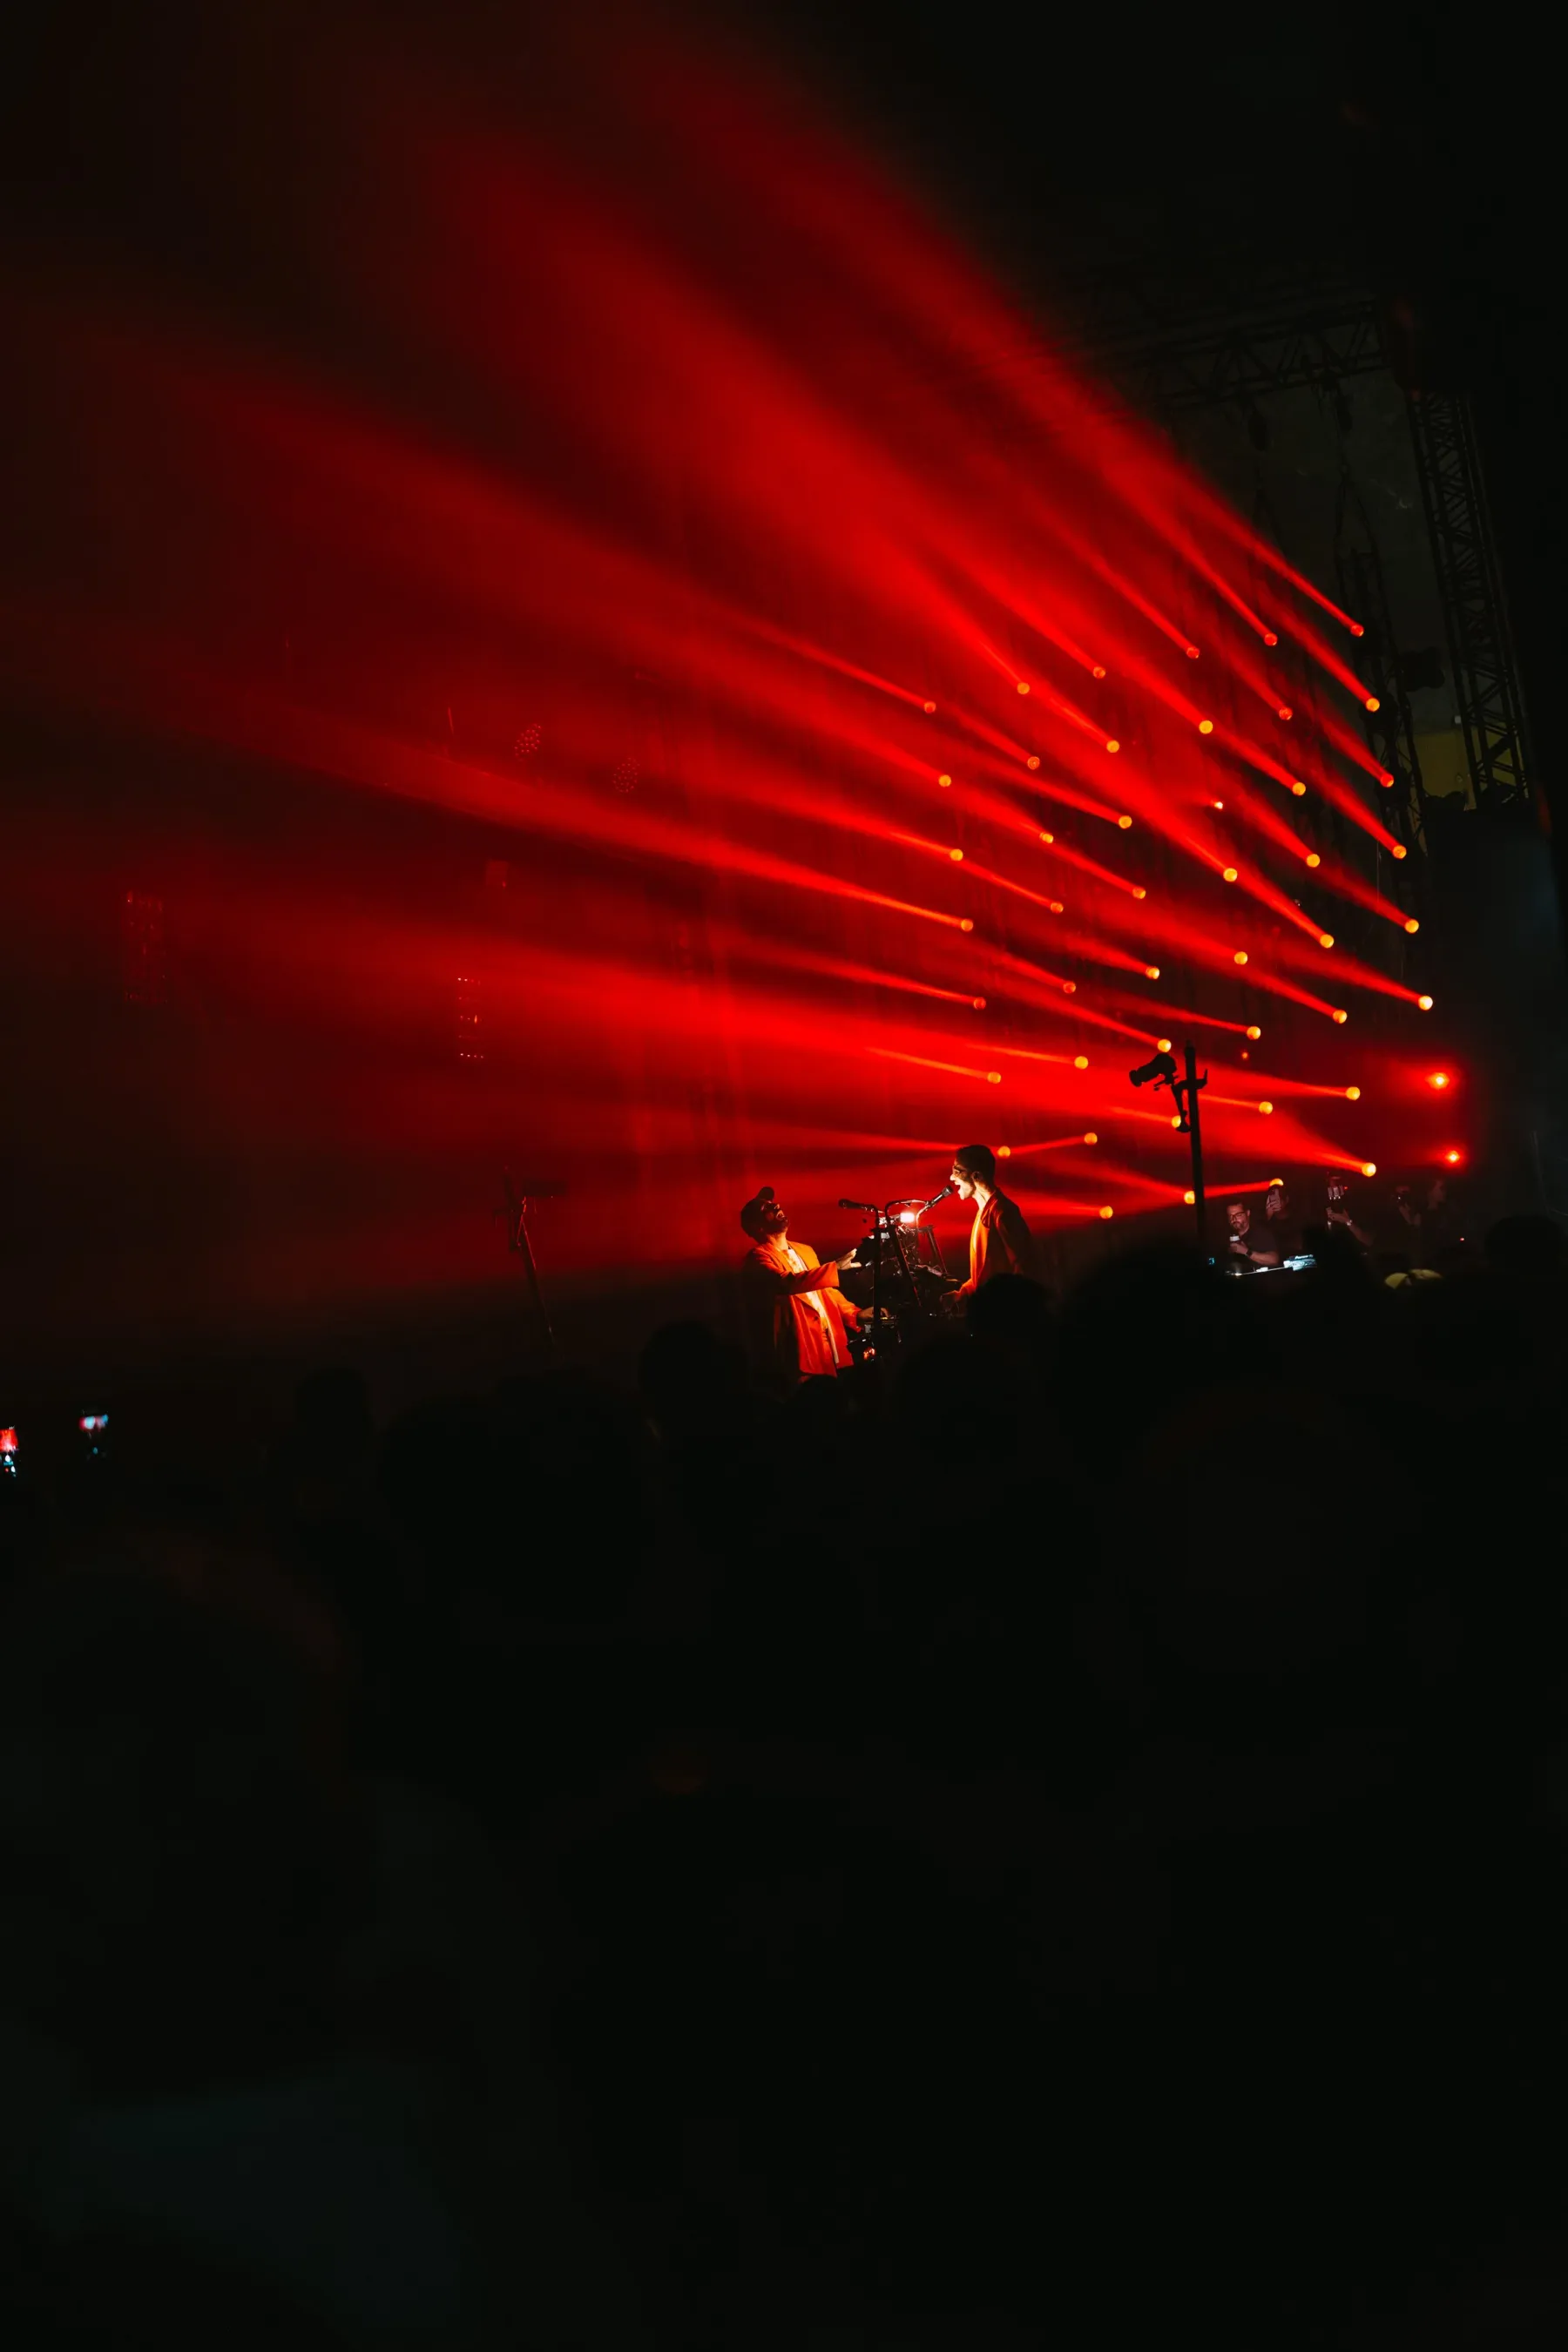
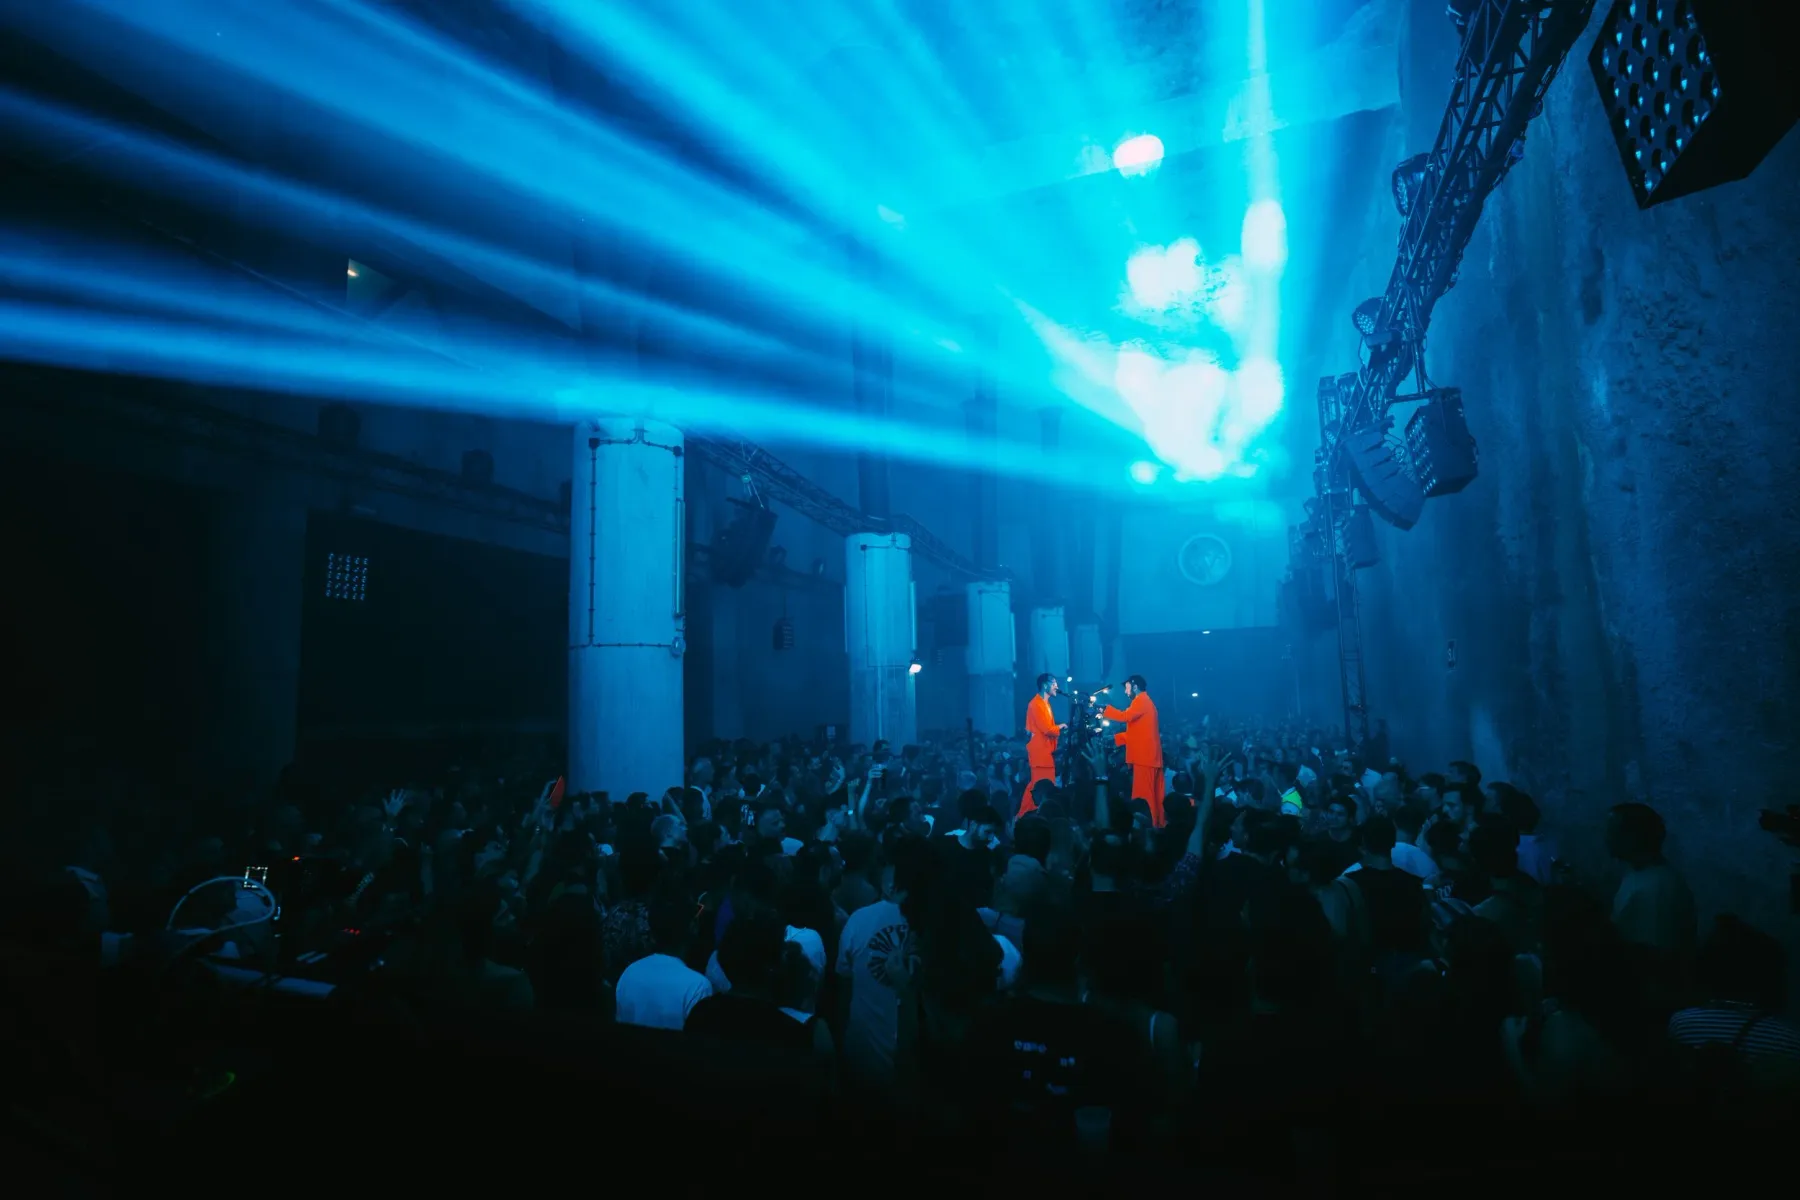
Amber, red, cyan. Three looks from Live Under Lisbon, 10 October 2026. On our sheet, every song is assigned a colour.
A better setlist workflow
Everyone around a show works from the setlist: promoters, technicians, media, production. It tells them where we are in the set, the lighting and laser colour, and the BPM for tempo-synced effects. Most are a spreadsheet printout. We wanted one sheet that reads at a glance in the dark.
So we built one. It runs in a browser and travels as a link.
One song per row. Number, name, colour, BPM, length, and the running time at the end of that song. Under the list, an energy curve. Each song is a flat step at its tempo, and each step is as wide as the song is long. You read the shape of the set at a glance: where it sits, where it climbs, where it breathes.
The footer holds the date and the venue.
The colour column is a stage-lighting cue. Some shows don’t need it, so each setlist can hide it, along with any other column. The name column grows into the gap and the numbers stay on the right.
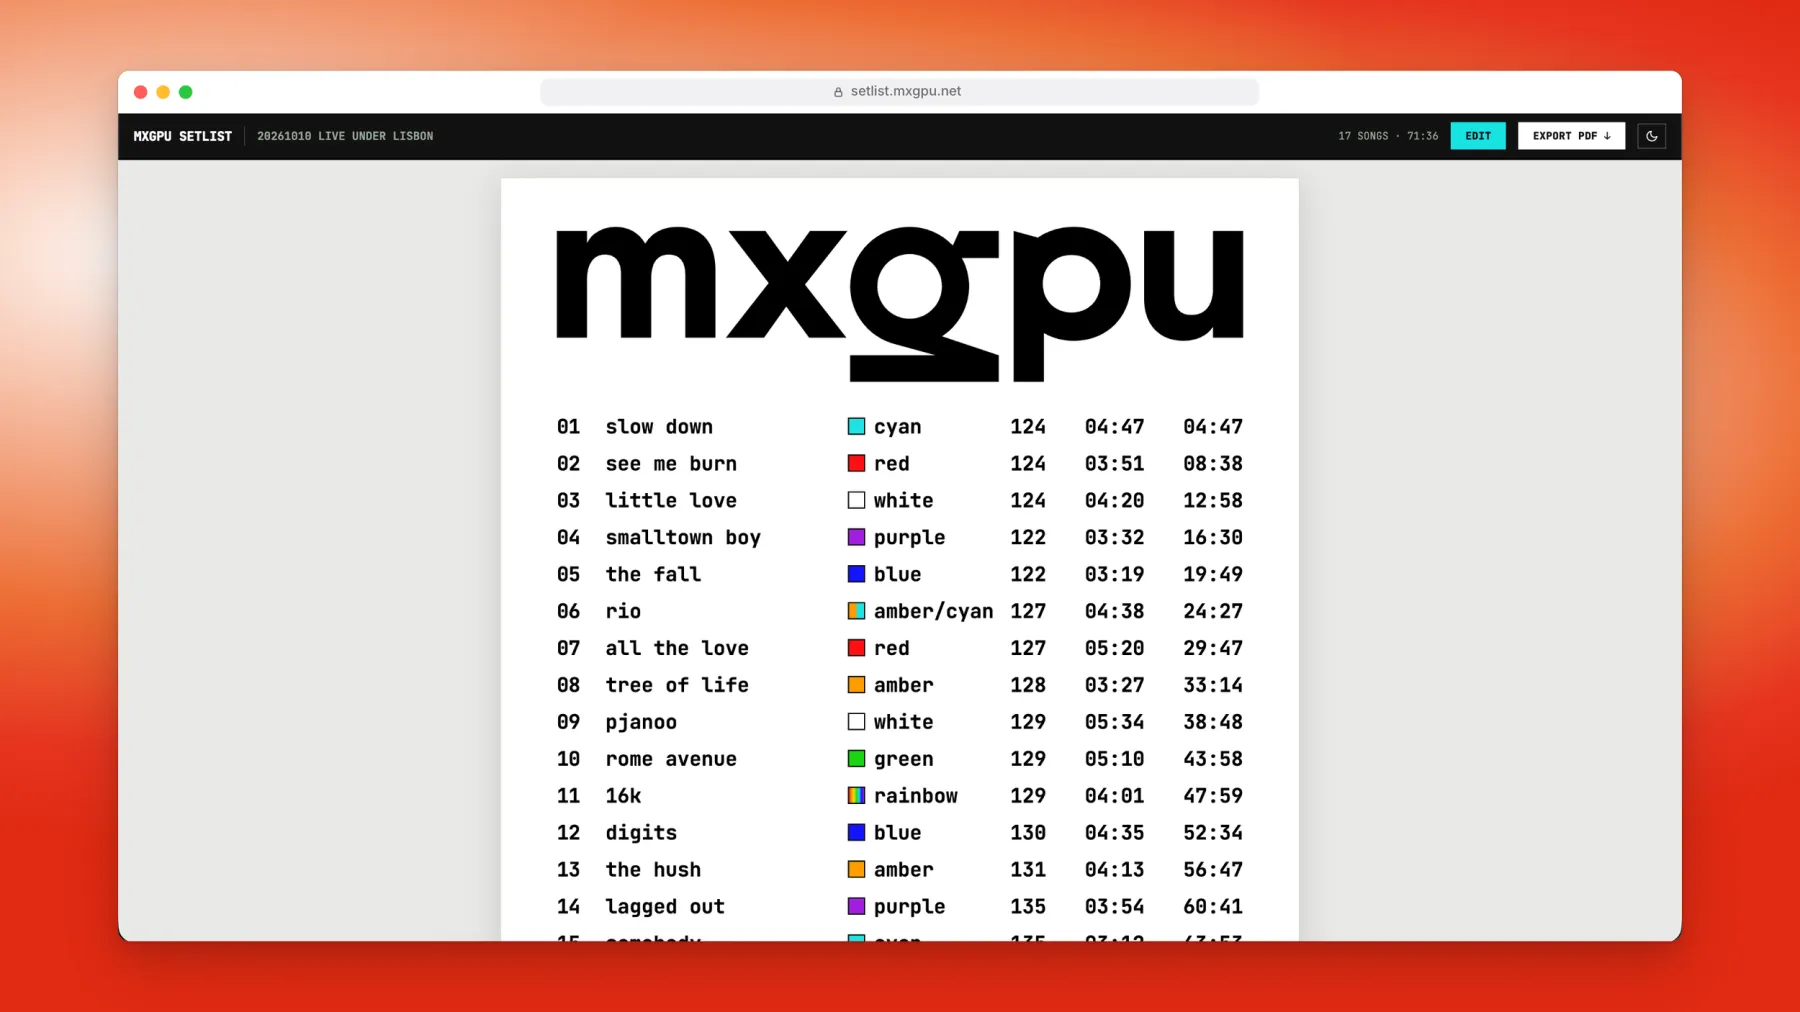
The public view. Anyone with the link sees the current setlist, read-only, and can export the PDF. This one is our Sonora Festival set.
Two faces
The root URL shows whichever setlist is marked current. Anyone with the link can read it on a phone or download the PDF. No login.
Editing sits behind a password. Once in, we drag songs into order, pick colours, set BPM and durations, and keep several named setlists side by side. Switching between them publishes nothing. A separate “Make current” button decides what the root URL serves.
Each setlist also gets its own address, derived from its name. “20260704 Sonora Festival” becomes /20260704-sonora-festival. The slug is never typed by hand, so the editor and the server always agree on it.
Songs can be hidden instead of deleted. A hidden song stays in the editor, dimmed, but drops out of the numbering, the running clock, the curve and the printed sheet. A shorter set never costs us the full one.
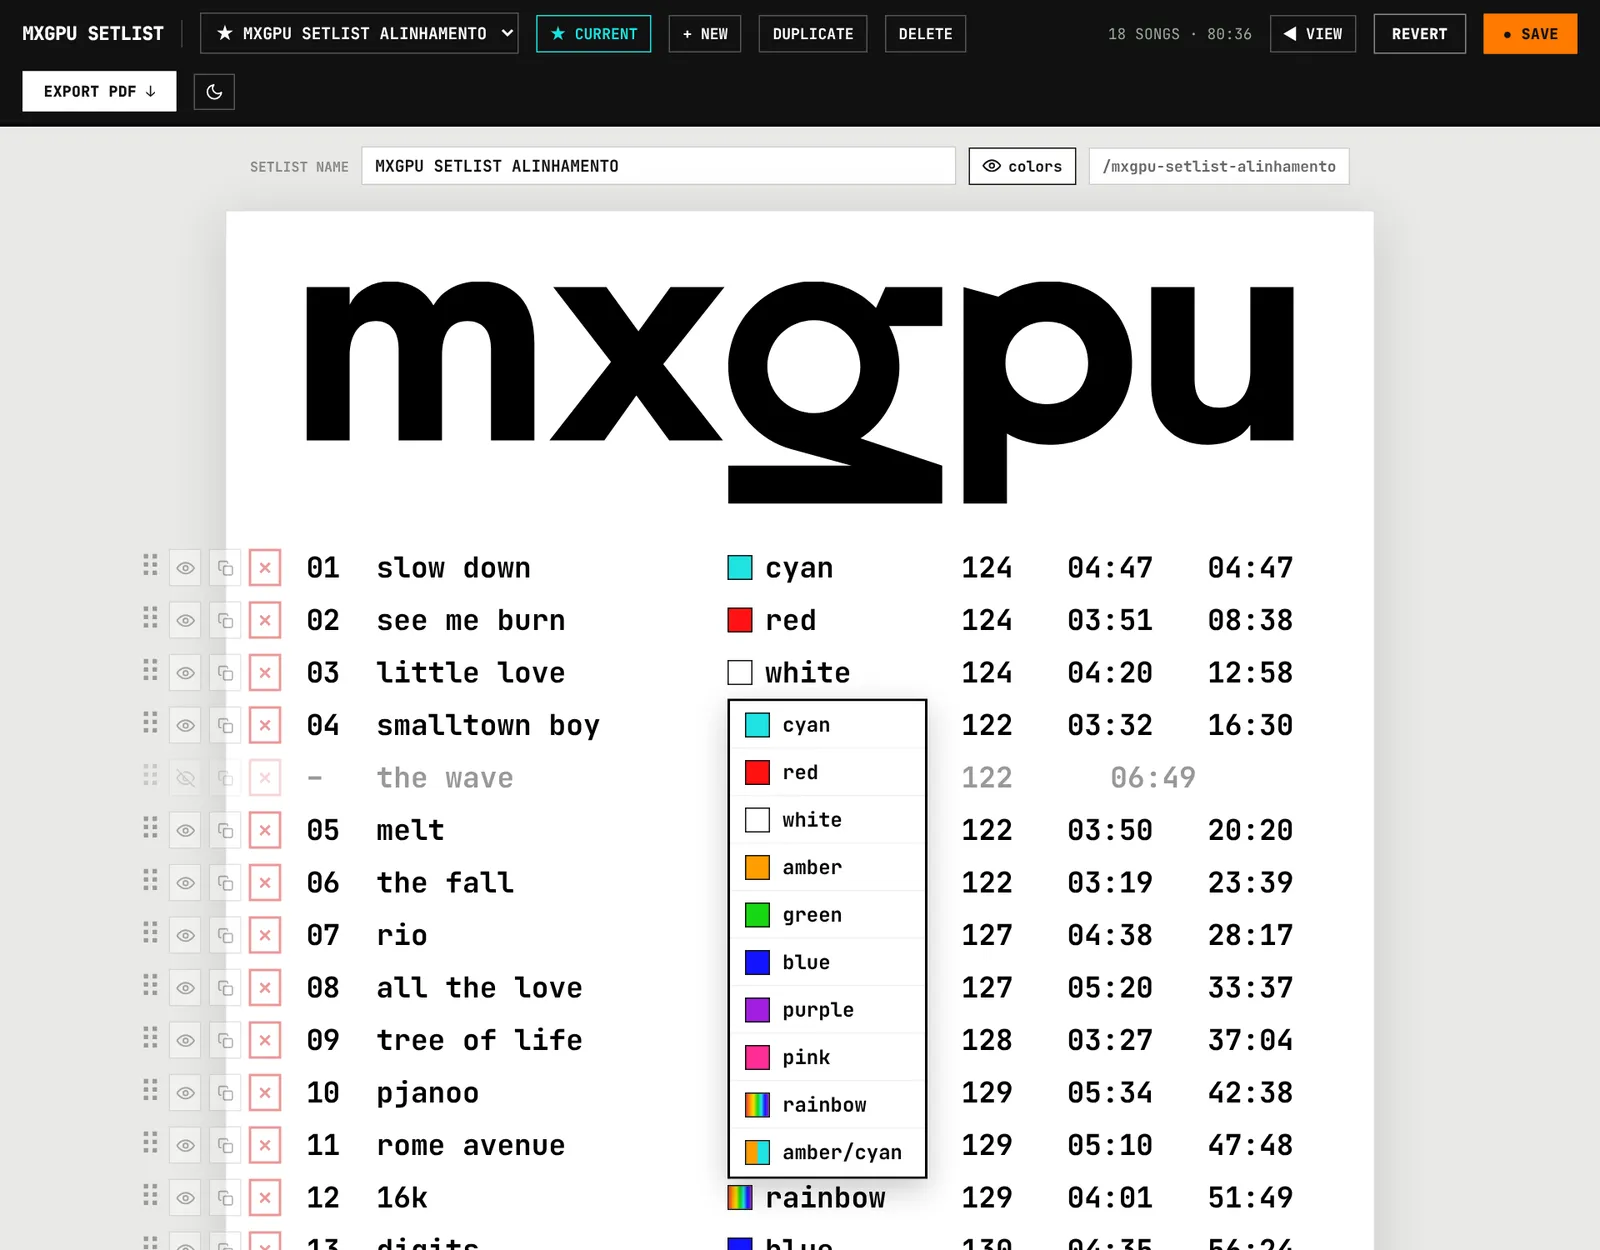
The editor. Song five is hidden, so the numbering and the running time skip it. The colour menu is open on song three.
Paper is the hard part
Printing from a browser looked simple. It wasn’t. iOS Safari spilled the sheet onto a blank second page. Print dialogs stamped URLs, dates and page numbers into the margins. So the PDF moved to the server.
The /api/pdf route builds the sheet as a self-contained HTML document, opens it in headless Chromium, scales it to fit one A4 page and prints exactly that page. The file is named after the setlist: 20260704_sonora.pdf.
How it is built
Next.js (App Router) and React, in TypeScript, hosted on Vercel.
Neon Postgres holds everything as one JSONB document: every setlist, plus a pointer to the current one.
The password lives only in a server environment variable. The server checks it with a constant-time compare and sets a signed, httpOnly cookie. Saving requires that cookie. The password never reaches the browser.
PDF export runs puppeteer-core with a serverless Chromium build.
JetBrains Mono everywhere, on screen and on paper. The MXGPU wordmark is an SVG.
Dark mode is screen-only. The sheet always prints black on white.
The curve is a few lines. Each song’s plateau gets its width from its duration and its height from its BPM:
// Step curve: a flat plateau per song (constant bpm), each song's WIDTH proportional
// to its duration, joined by short rounded transitions.
export function buildCurve(songs: Song[]): string {
  if (!songs.length) return '';
  const W = 1000, H = 120, pad = 14;
  const secs = songs.map((s) => toSec(s.duration) || 1);
  const total = secs.reduce((a, b) => a + b, 0) || 1;
  const bpms = songs.map((s) => parseInt(s.bpm, 10) || 0);
  const lo = Math.min(...bpms), hi = Math.max(...bpms);
  const span = hi - lo || 1;
  const y = (b: number) => H - pad - ((b - lo) / span) * (H - 2 * pad);
  // … then one flat step per song, joined by short rounded curves
  // (the full function is in lib/setlist.ts)
}
Make your own
The engine is open source under the MIT License, at github.com/ekkolabs/setlist. Download it, install it, change it, run your own.
Your logo, typefaces and name all live in one file, site.config.ts. So do the columns: numbers, colours, BPM, durations, running time, the curve and the footer can each be switched off for the whole site, or shown and hidden per setlist from the editor. The PDF follows the same choices.
To run it locally: clone the repo, npm install, copy .env.example to .env.local with your own password and a Neon Postgres URL, then npm run dev. To put it online, deploy to Vercel with the same three variables.